Detector
Each MODS uses two E2V CCD231-68 monolithic backside-illuminated 8292×3088 15-micron pixel CCDs. The blue channel detector is 15-micron thick standard silicon with a proprietary Astro-BroadBand coating and the red channel detector is 40-micron thick deep-depletion silicon with a proprietary Astro-ER1 coating. Each CCD is read out through 4 amplifiers, one at each corner. The quadrants are designated Q1 through Q4, from bottom left to top right, as depicted in Figure 1 below. The charge in each row of a quadrant is shifted vertically up (Q3 & Q4) or down (Q1 & Q2) and then to the left or right, as indicated by the arrows, to be read out through the amplifier. There are 50 pixels of prescan between the amplifier at the first data pixel, and the horizontal shift registers at the top and bottom are 8 rows high, so the “active” region is 8192×3072 pixels.
Readout Scheme
The specifics of the readout scheme changed with the controller upgrade in August 2025 and both new and old schemes are described below.
Archon Controllers (after Sep 2025)
With the Archon controllers, the first 50 pixels read out in each line of a quadrant of an unbinned full-frame (8K x 3K) image are the prescan, the next 4096 are the data and, finally, there are 32 pixels of overscan. The top 8 and bottom 8 rows are not sensitive to light. A full-frame raw image would have 8356 x 3088 pixels: 2 x 50 prescan + 2 x 4098 physical + 2 x 32 overscan pixels. Only the full-frame images have prescan, but all readout modes (8Kx3K, 4Kx3K and 3Kx3K) have overscan. The diagrams below illustrate the read out scheme, first for the full-frame, and then for a single quadrant.


Figure 1: Archon full frame readout (top) and readout for a single quadrant, Q1 (bottom). Figure courtesy of R. Pogge.
Original Controllers (before Aug 2025)
Before the controller upgrade in 2025, each quadrant was read out through two output chains to reduce overheads as illustrated in Figure 2 below. Each output channel had a slightly different gain and bias level, and this led to the even/odd column striping which was apparent in raw images. The modsCCDRed package of python scripts is available to process these raw images. Only 48, not 50, prescan pixels were read out per quadrant, and there was no overscan, so the full-frame raw image dimensions are 8288 x 3088 pixels. The 48 columns of prescan on full-frame images were used like overscan to subtract the bias level. The other readout regions of interest did not have this prescan and therefore bias frames were required to reduce these.

Figure 2: Original readout scheme. Each quadrant is read out via 2 channels, one for the even and the other for the odd columns. Figure taken from the MODS Instrument Manual.
CCD Regions of Interest and Binning
The 8K x 3K detector is wide enough to image the entire grating spectrum of a target anywhere within ~6 arcmin x 6 arcmin focal plane, but a subset of pixels can be read out when the instrument is used in other modes: 4K×3K for prism spectra and 3K×3K for imaging and acquisition modes. Because detector overheads are now so short with the Archon controllers, the 1Kx1K region of interest and binned 3Kx3K and 4Kx3K modes are no longer supported. The primary readout modes are depicted in the image below, and the supported ROIs and binning are summarized in Table 1. Please see the Preparing to Observe section for the detector overheads in each of the supported modes.

Figure 4: CCD Regions of Interest. Figure courtesy of R. Pogge.
Table 1: Supported ROIs and binning
| ROI | naxis1 x naxis2 | Binning |
| 8K x 3K (full frame/grating) | 8292 x 3088 | 1×1, 1×2, and 2×2 |
| 3K x 3K (imaging/acquisition) | 3088 x 3088 | 1×1 only |
| 4K x 3K (prism) | 4096 x 3088 | 1×1 only |
With the original controllers, although 2×2 binning was enabled, it was strongly discouraged because it tended to produce pronounced electronic artifacts along rows or segments of rows. Some examples are shown on the Image Artifacts and Features page.
MODS1 Detector Overview
The basic properties of the CCDs measured at operating temperature (~ -100°C) are summarized in the tables below. The conversion gain, readout noise, linearity, and dark current are average values for the four quadrants, measured on-telescope under normal operating conditions.
| BLUE | RED | |
|---|---|---|
| Science CCDs | e2v CCD231-68 3072×8192 (15um pixels) Std Silicon + Astro-Broadband coating |
e2v CCD231-68 3072×8192 (15um pixels) 40um Deep-Depletion Silicon + Astro-ER1 coating |
| Field of View | ~6.0×6.0 arcmin (~3000×3000 pixels) | ~6.0×6.0 arcmin (~2900×2900 pixels) |
| Focal Plane Scale | 1.667 arcsec/mm | 1.667 arcsec/mm |
| Measured Image Quality (80%EE) | Blue Camera (400nm): 0.25-arcsec inner 2-arcmin (best focus) 0.43-arcsec inner 4-arcmin 0.55-arcsec 6-arcmin |
Red Camera (700nm): 0.29-arcsec inner 2-arcmin (best focus) 0.41-arcsec inner 4-arcmin 0.51-arcsec 6-arcmin |
| Imaging Pixel Scale | 0.120 arcsec/pixel | 0.123 arcsec/pixel |
| ADC Saturation (ADU) | 65535 | 65535 |
| Pixel Full Well | 200,000e–/gain (~80,000 ADU) | 200,000e–/gain (~80,000 ADU) |
| Typical CTE | 99.9995% | 99.9995% |
| Conversion Gain (e–/ADU)1 | (2.1) | (2.5) |
| Readout Noise (e–)1 | (3.0) | (4.2) |
| Linearity | <1% @ 55K ADU | <1% @ 52K ADU |
| Dark Current (e–/pixel/hr) | 0.5±0.2 | 0.4±0.1 |
1 The numbers in parentheses represent the gain or readnoise determined from data taken on 09-Nov-2016 with the original controllers. The gain and readnoise measured with the Archon controllers are similar: gain = 2-2.5 e-/ADU and readnoise = 3-4 e-; and the table will be updated to include these.
MODS1 gain and readnoise for each quadrant, determined using Janesick’s photon transfer curve method, from data taken 09-Nov-2016.
| Channel | Quadrant | Conversion Gain (e–/ADU) | Readout Noise (e–) |
|---|---|---|---|
| Blue | Q1 | 2.55 | 3.41 |
| Q2 | 1.91 | 2.93 | |
| Q3 | 2.09 | 2.92 | |
| Q4 | 2.02 | 2.76 | |
| Red | Q1 | 2.38 | 3.78 |
| Q2 | 2.50 | 4.04 | |
| Q3 | 2.46 | 4.74 | |
| Q4 | 2.81 | 4.14 |
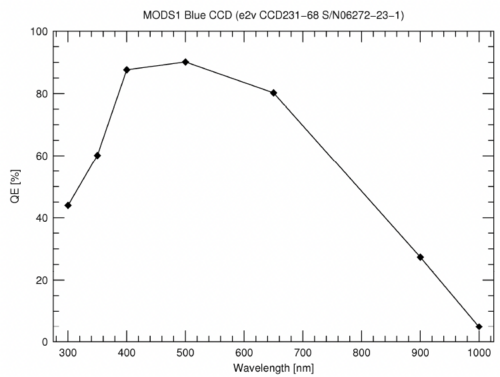
MODS1 Detector Quantum Efficiency
 |
 |
| Wavelength (nm) | QE (%) | |
|---|---|---|
| MODS1 BLUE | MODS1 RED | |
| 300 | 43.9 | 48.7 |
| 350 | 60.1 | 36.6 |
| 400 | 87.6 | 56.1 |
| 500 | 90.1 | 78.7 |
| 650 | 80.2 | 96.8 |
| 900 | 27.3 | 58.8 |
| 1000 | 4.9 | 12.6 |
MODS2 Detector Overview
| BLUE | RED | |
|---|---|---|
| Science CCDs | e2v CCD231-68 3072×8192 (15um pixels) Std Silicon + Astro-Broadband coating |
e2v CCD231-68 3072×8192 (15um pixels) 40um Deep-Depletion Silicon + Astro-ER1 coating |
| Field of View | ~6.0×6.0 arcmin (~3000×3000 pixels) | ~6.0×6.0 arcmin (~2900×2900 pixels) |
| Focal Plane Scale | 1.667 arcsec/mm | 1.667 arcsec/mm |
| Measured Image Quality (80%EE) | Blue Camera (400nm): 0.25-arcsec inner 2-arcmin (best focus) 0.43-arcsec inner 4-arcmin 0.55-arcsec 6-arcmin |
Red Camera (700nm): 0.29-arcsec inner 2-arcmin (best focus) 0.41-arcsec inner 4-arcmin 0.51-arcsec 6-arcmin |
| Imaging Pixel Scale | 0.120 arcsec/pixel | 0.123 arcsec/pixel |
| ADC Saturation (ADU) | 65535 | 65535 |
| Pixel Full Well | 200,000e–/gain (~80,000 ADU) | 200,000e–/gain (~80,000 ADU) |
| Typical CTE | 99.9995% | 99.9995% |
| Conversion Gain (e–/ADU)1 | (2.0) | (1.7) |
| Readout Noise (e–)1 | (3.7) | (2.8) |
| Linearity | <1% @ 55K ADU | <1% @ 52K ADU |
| Dark Current (e–/pixel/hr) | 0.5±0.2 | 0.4±0.1 |
1 The numbers in parentheses represent the gain or readnoise determined from data taken on 09-Nov-2016 with the original controllers. The gain and readnoise measured with the Archon controllers are similar: gain = 2-2.5 e-/ADU and readnoise = 3-4 e-; and the table will be updated to include these.
MODS2 gain and readnoise for each quadrant, determined using Janesick’s photon transfer curve method, from data taken 09-Nov-2016.
| Channel | Quadrant | Conversion Gain (e–/ADU) | Readout Noise (e–) |
|---|---|---|---|
| Blue | Q1 | 1.99 | 3.66 |
| Q2 | 2.06 | 3.62 | |
| Q3 | 1.96 | 3.72 | |
| Q4 | 2.01 | 3.64 | |
| Red | Q1 | 1.70 | 2.95 |
| Q2 | 1.67 | 2.65 | |
| Q3 | 1.66 | 2.78 | |
| Q4 | 1.66 | 2.87 |
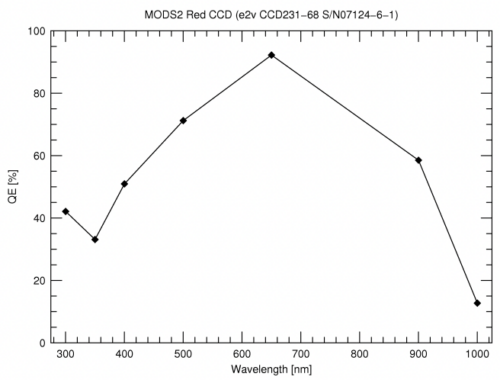
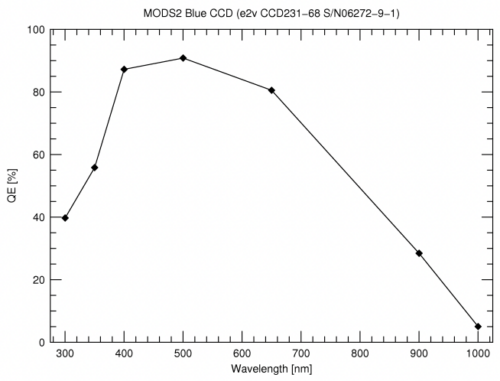
MODS2 Detector Quantum Efficiency
 |
|
| Wavelength (nm) | QE (%) | |
|---|---|---|
| MODS2 BLUE | MODS2 RED | |
| 300 | 39.7 | 42.1 |
| 350 | 55.8 | 33.1 |
| 400 | 87.2 | 50.9 |
| 500 | 90.8 | 71.2 |
| 650 | 80.5 | 92.2 |
| 900 | 28.4 | 58.5 |
| 1000 | 5.0 | 12.7 |
Data Files
MODS data taken with the original controllers (before 20250801) were stored as simple FITS files, but data taken with the Archon controllers (after 20250901) are now stored as multi-extension FITS files, where extensions 1-4 hold the raw data as read out from each of the Archon ADC channels, IM1 through IM4, extension 5 is a FITS Bin Table containing the Archon controller status at the start of exposure, and extension 6 holds the overscan-subtracted/trimmed/merged image.
Filename: mods1r.20260407.0027.fits

No.    Name      Ver    Type      Cards   Dimensions   Format

0  PRIMARY       1 PrimaryHDU     228   ()

1  IM1           1 ImageHDU        74   (4178, 1544)   int16 (rescales to uint16)

2  IM2           1 ImageHDU        74   (4178, 1544)   int16 (rescales to uint16)

3  IM3           1 ImageHDU        74   (4178, 1544)   int16 (rescales to uint16)

4  IM4           1 ImageHDU        74   (4178, 1544)   int16 (rescales to uint16)

5  CONPARS       1 BinTableHDU     13   205R x 2C   [20A, 20A]

6  MERGED        1 ImageHDU       240   (8292, 3088)   float32

Figure 5: Mapping of the Archon ADC channels: IM1, IM2, IM3, IM4; to detector quadrants: Q1, Q2, Q3 and Q4. Figure courtesy of R. Pogge.