Image Artifacts and Features
IR laser spots


Dichroic Ghosts
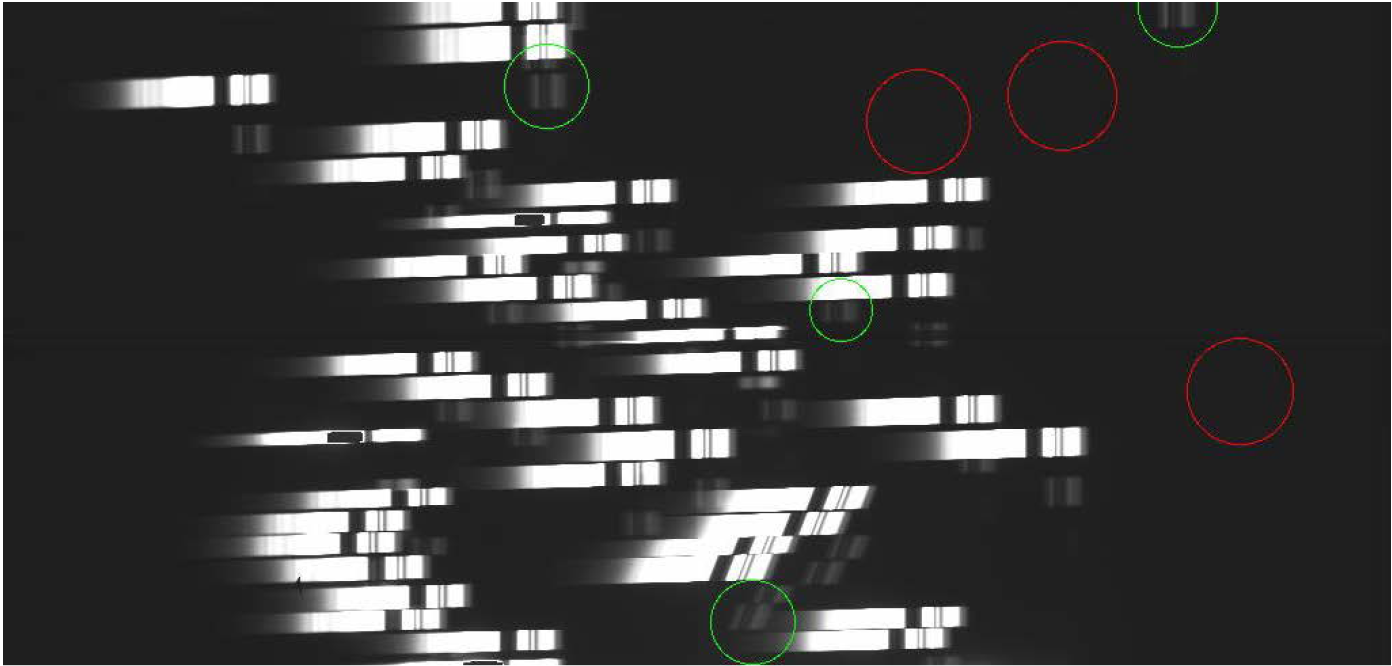

Figure: This MODS1 Red channel spectrum of the bright spectrophotometric standard, Hz44, illustrates the blue leak through the dichroic and the dichroic ghost that is 145 pixels below the target spectrum.
Stray light
Light from bright stars (V<~5, but this depends on the image depth) within an (1.9-4 deg) annulus about the target grazes the outer edge of the undersized adaptive secondary mirrors on both SX and DX sides and produces diffuse arcs on both MODS1 and MODS2 images. The outer edge of the arc is determined by a stop within MODS and the inner edge by the rim of the adaptive secondary. The arcs move as the instrument rotates to follow the sky. When the slightly larger rigid secondary is mounted, these arcs are minimized or not seen.
Installation of a baffle around the adaptive secondary would be needed to eliminate these stray light arcs. The baffle would have to be temporary/deployable because emission from it would hamper near- and mid-IR observations at wavelengths longer than K band.
For now, observers can offset the target away from the arc, though this will not insure it will remain free from contamination throughout the observation.
PIs and observers can search for bright stars within a 1.9-4 deg annulus of the field center using a web-based vizier search or, if the cdsclient package has been installed, using the vizquery command.
vizquery -mime=text -source=V/50 -c=Jhhmmss.sss+ddmmss.ss -c.rm=114-240 -out.add=’_r _raj2000 _decj2000′ -out.max=unlimited -oc.form=d Vmag=0..5
will query the Bright Star Catalog (Hoffleit et al. 1991, I/50) for stars with V=0-5 in an annulus 114-240 arcmin about the coordinates hhmmss.ss and ddmmss.ss at center.
A particularly egregious example of these stray light arcs is shown below, for a field that was only 2 degrees from the V=-0.05 mag RGB star, Arcturus. Figure 6.1 (below) illustrates how the the arc differs between the blue and red channels and its location changes as the instrument rotates.


Figure: The top panel shows how the arcs in the initial MODS1 Blue acquisition image, taken at PA= 60 deg, disappear when the instrument is rotated by 180 degrees, to PA = -120. However, the effect of the arc shows up prominently on the series of MODS1 Red channel spectra, and images taken immediately afterwards show that, for the MODS1 Red channel, the arc contaminates the light which is entering the slit.
Gradient in MODS2 internal imaging flats
The internal calibration unit in MODS2, unlike that in MODS1, does not provide an even illumination. The counts drop by 20% from the center to the edge of the 3K x 3K imaging field of view. If a uniform imaging flat is needed, for extended objects, e.g., then it is recommended to obtain twilight sky flats with MODS2.
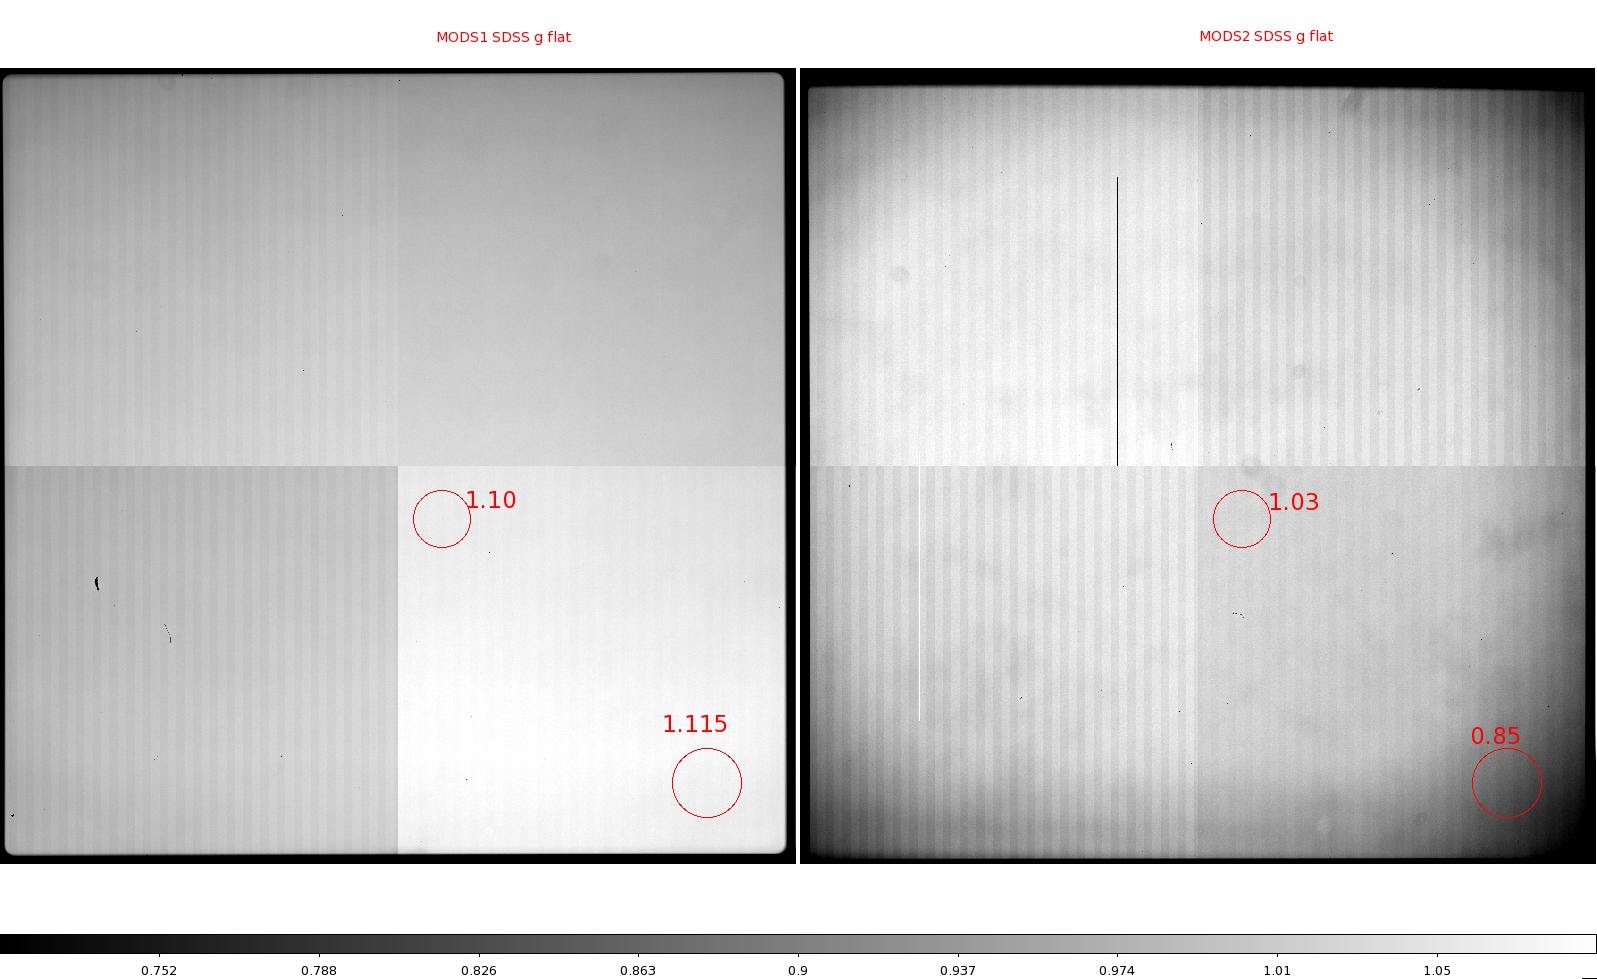
Figure: Imaging 3K x 3K flats (sdss g) for MODS1B (left) and MODS2B (right). In the MODS2B flat, the illumination falls off by ~20% from the center to corner of the image, but in the MODS1B flat, the illumination is approximately flat (in fact it is a little brighter at the bottom right).
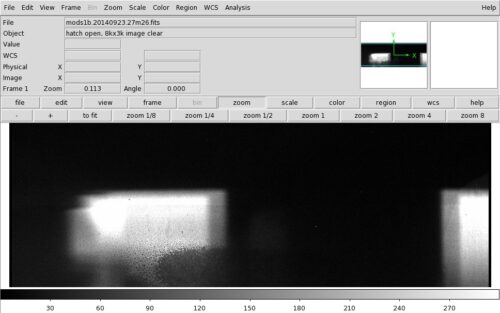
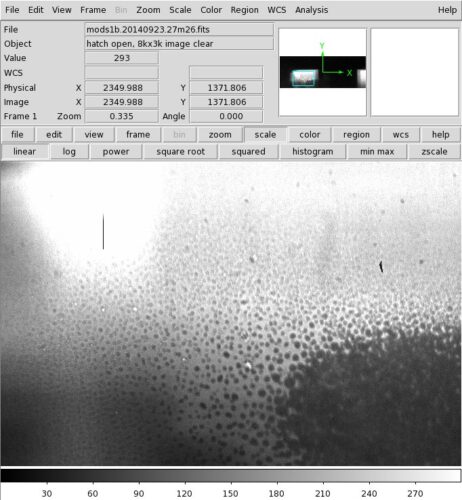
Condensation on the Optics
Some images which show condensation on the MODS1 Blue field flattener, which occurred during a period of high humidity in September 2014, appear below.
As described in IT 5324, the instrument specialist gained access to the field flattener by opening the filter change hatch and the port in the filter wheel cover. When the blue filter wheel was set to the empty position, dry nitrogen could be directed to the optic. This and ambient lower humidity resolved the problem.
Amplifier Glow
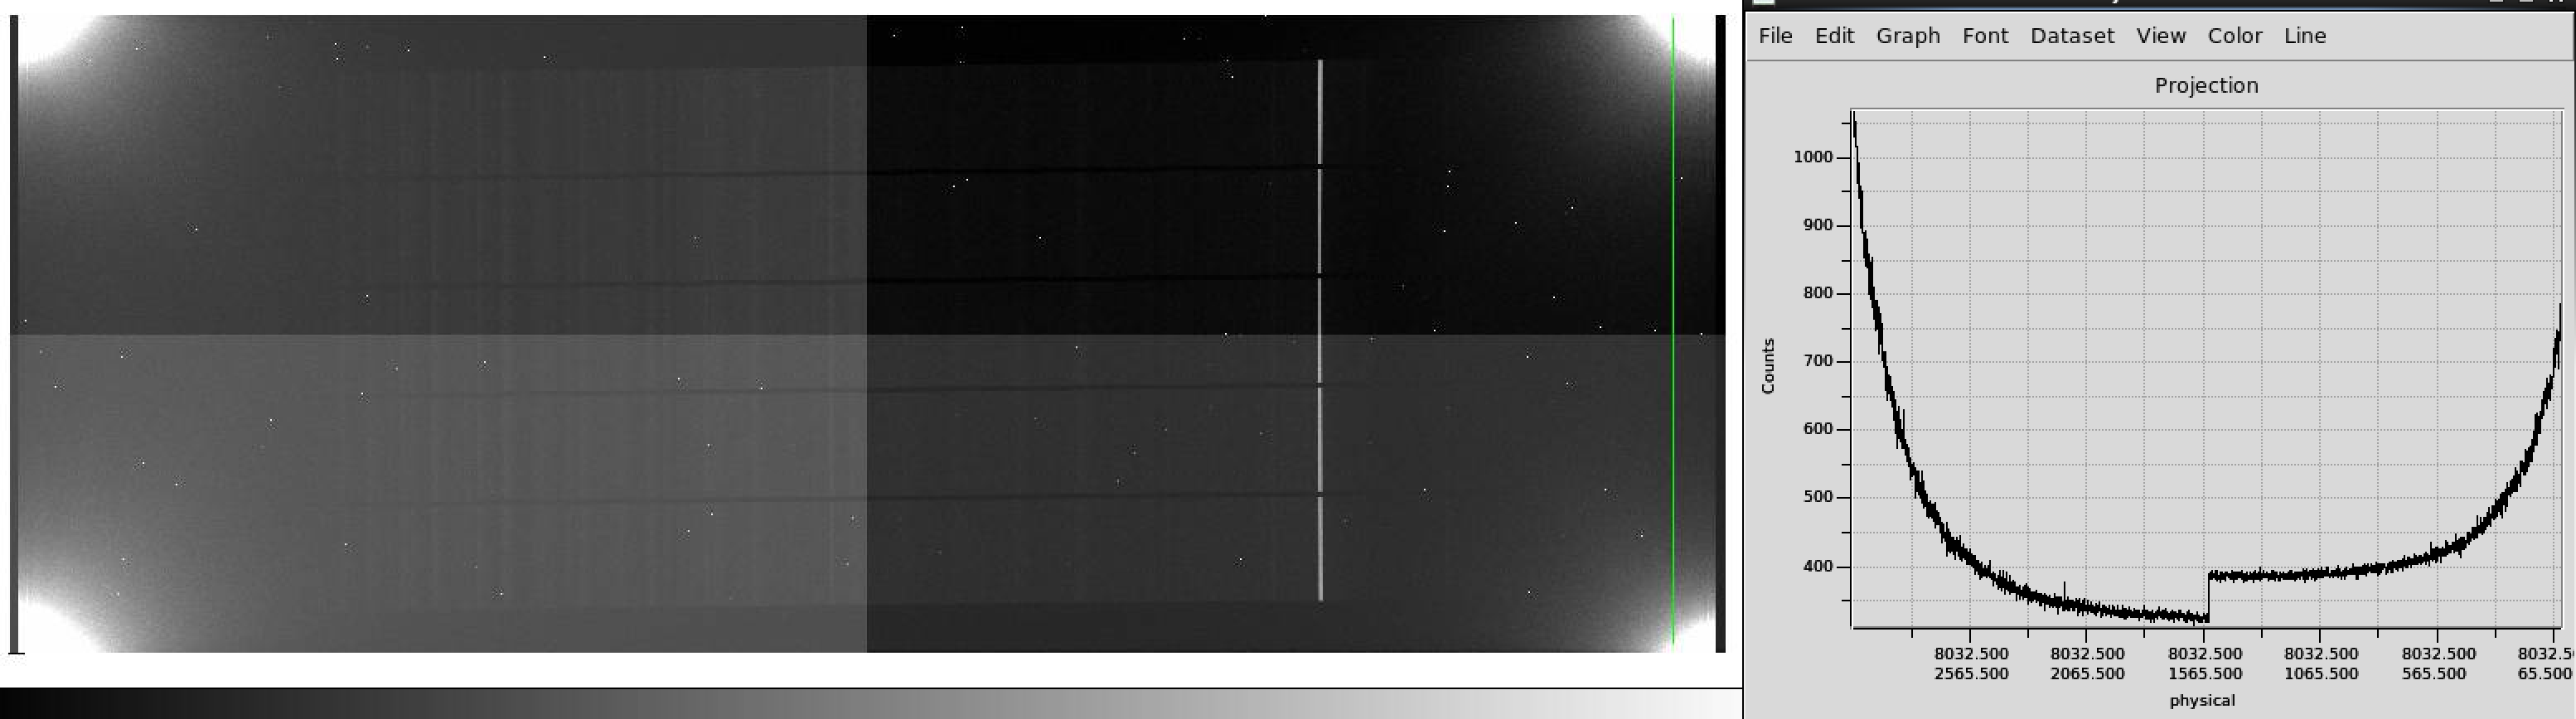
Figure: A MODS2 Blue channel image with amplifier glow in all four corners. Counts along the green vertical line from top to bottom are plotted to the right. Full-frame images from both the Blue and Red channels of MODS2 show amplifier glow, but in this particular example the glow is relatively bright. Neither Blue nor Red channel images of MODS1 show amplifier glow.
Missing Rows in the MERGED image
Sometimes the overscan-subtracted, trimmed, merged images (extension 6) displayed by modsDisp will be missing rows. Pixel values in these rows are all 0. Don’t panic, as the individual quadrant data in extensions 1-4 are intact. The merged image on the MODS instrument server also has these missing rows, so the problem seems to originate in the image processing on that computer. See Quick Look Tools for instructions on how to display an individual extension, and note that the quadrants are labeled, from lower left to upper right as Q1, Q2, Q3 and Q4, but these correspond to extensions 3, 4, 1 and 2, respectively, with flips along columns for extensions 3 and 1, and flips along both columns and rows for extensions 4 and 2.

Readout Artifacts post-Upgrade (after Sep 2025)
Crosstalk
There is crosstalk, primarily between ADC readout channels IM1 & IM2 and IM3 & IM4, but faint victim images can be seen in other quadrants for MODS1B and MODS2R, in particular. An illustration of crosstalk in MODS1B and MODSR is below and for MODS2R, below that. The crosstalk has not yet been characterized quantitatively.


Saturation Effects
With the new controllers, heavily saturated images MODS1 Red show trailing along columns in both directions, as well as charge smearing towards the central column, i.e. away from the amplifier. In MODS2 Red, the trailing is mostly in the horizontal direction, but subsequent images will show faint trails going up (quadrants 3 & 4, IM1 and IM2) or down (quadrants 1 & 2, IM3 and IM4) from the region of saturation. These effects are illustrated below for MODS1 Red (top) and MODS2 Red (bottom), where a saturated sieve Mask image is displayed on the left, and a non-saturated sieve Mask image taken soon afterwards is displayed on the right. The trails left by heavy saturation on MODS2 Red persist for quite a long time and can compromise the spectroscopic data, in particular multi-object data where the target spectra cover most of the detector. To mitigate this, for MOS acquisitions, use the minimum time needed to centroid accurately on the alignment stars. For long-slit observations, the trace of the target may avoid the “persistence” trail, unless the target is extended or the bright star is very close to the target, in which case it would be advisable to take the acquisition field image through the 5″ wide slit mask in order to block the bright star. Please contact observatory staff (sciops@lbto.org) for help with setting up this type of acquisition.


Readout Artifacts
Wavy vertical lines in MODS1R and MODS2B slit images
MODS1R and MODS2B slit images (or any low-background exposures) and biases show wavy, vertical lines in the lower left (MODS1R) and upper left and right (MODS2B) quadrants. These are at a fixed location on the detector and are seen in all ROIs which include that region. The vertical structure and intensity changes from exposure to exposure or bias to bias. The wavy appearance is produced by some smearing towards the central column, i.e. away from the pixel that is read out first. These are most notable in MODS1R slit acquisition images, an example of which is below. This is an overscan-subtracted, trimmed, merged image as would be displayed by modsDisp, and the maximum count level of the artifact in this image is 36 ADU.

Turndown in lower left quadrant of MODS2R biases
Some MODS2R biases show a turndown in the bottom left quadrant (Q1, Archon ADC channel IM3). This usually appears only after the first bias in the sequence, and it is seen at least for the ROIs 8Kx3K, 4Kx3K and 3Kx3K. The 8Kx3K bias shown below illustrates the effect. The turndown appears in the raw quadrant data (extension 3), and it is not removed in the overscan-subtracted, trimmed, merged image, extension 6, because the overscan subtraction uses a single value for the region instead of a row-by-row subtraction, something which works well for all other quadrants of MODS2R and for the other channels. The amplitude of this effect is small, ~6 ADU, as the plot below shows, and it does not seem to appear in anything besides the biases.


Readout Artifacts (before Sep 2025)
Vertical striping (Even-Odd effect)

This produces a vertical striping on the raw images, the ‘even-odd’ effect. This can be removed using the overscan (actually, the prescan) regions through the task, modsBias, which is part of the modsCCDRed package. While observing, copy your image to a /scratch directory and run modsBias on it:

Saturation Effects


Readout Artifacts in binned images
For programs requiring a high cadence series of observations, binning along only the spatial, but not the dispersion axis (1×2 binning, ccdbin 1 2), is recommended as a compromise which will reduce overheads but not produce electronic artifacts. Read+write overheads are reduced by a factor one-third for 1×2 binned data, and a factor one-half for 2×2 binning as compared to unbinned (1×1) data.
The images below illustrate these electronics artifacts on MODS1 Red and Blue channel images. As the MODS2 detectors use the same types of controllers, we expect similar artifacts on 2×2 binned MODS2 images, however, we have not examined these as carefully.
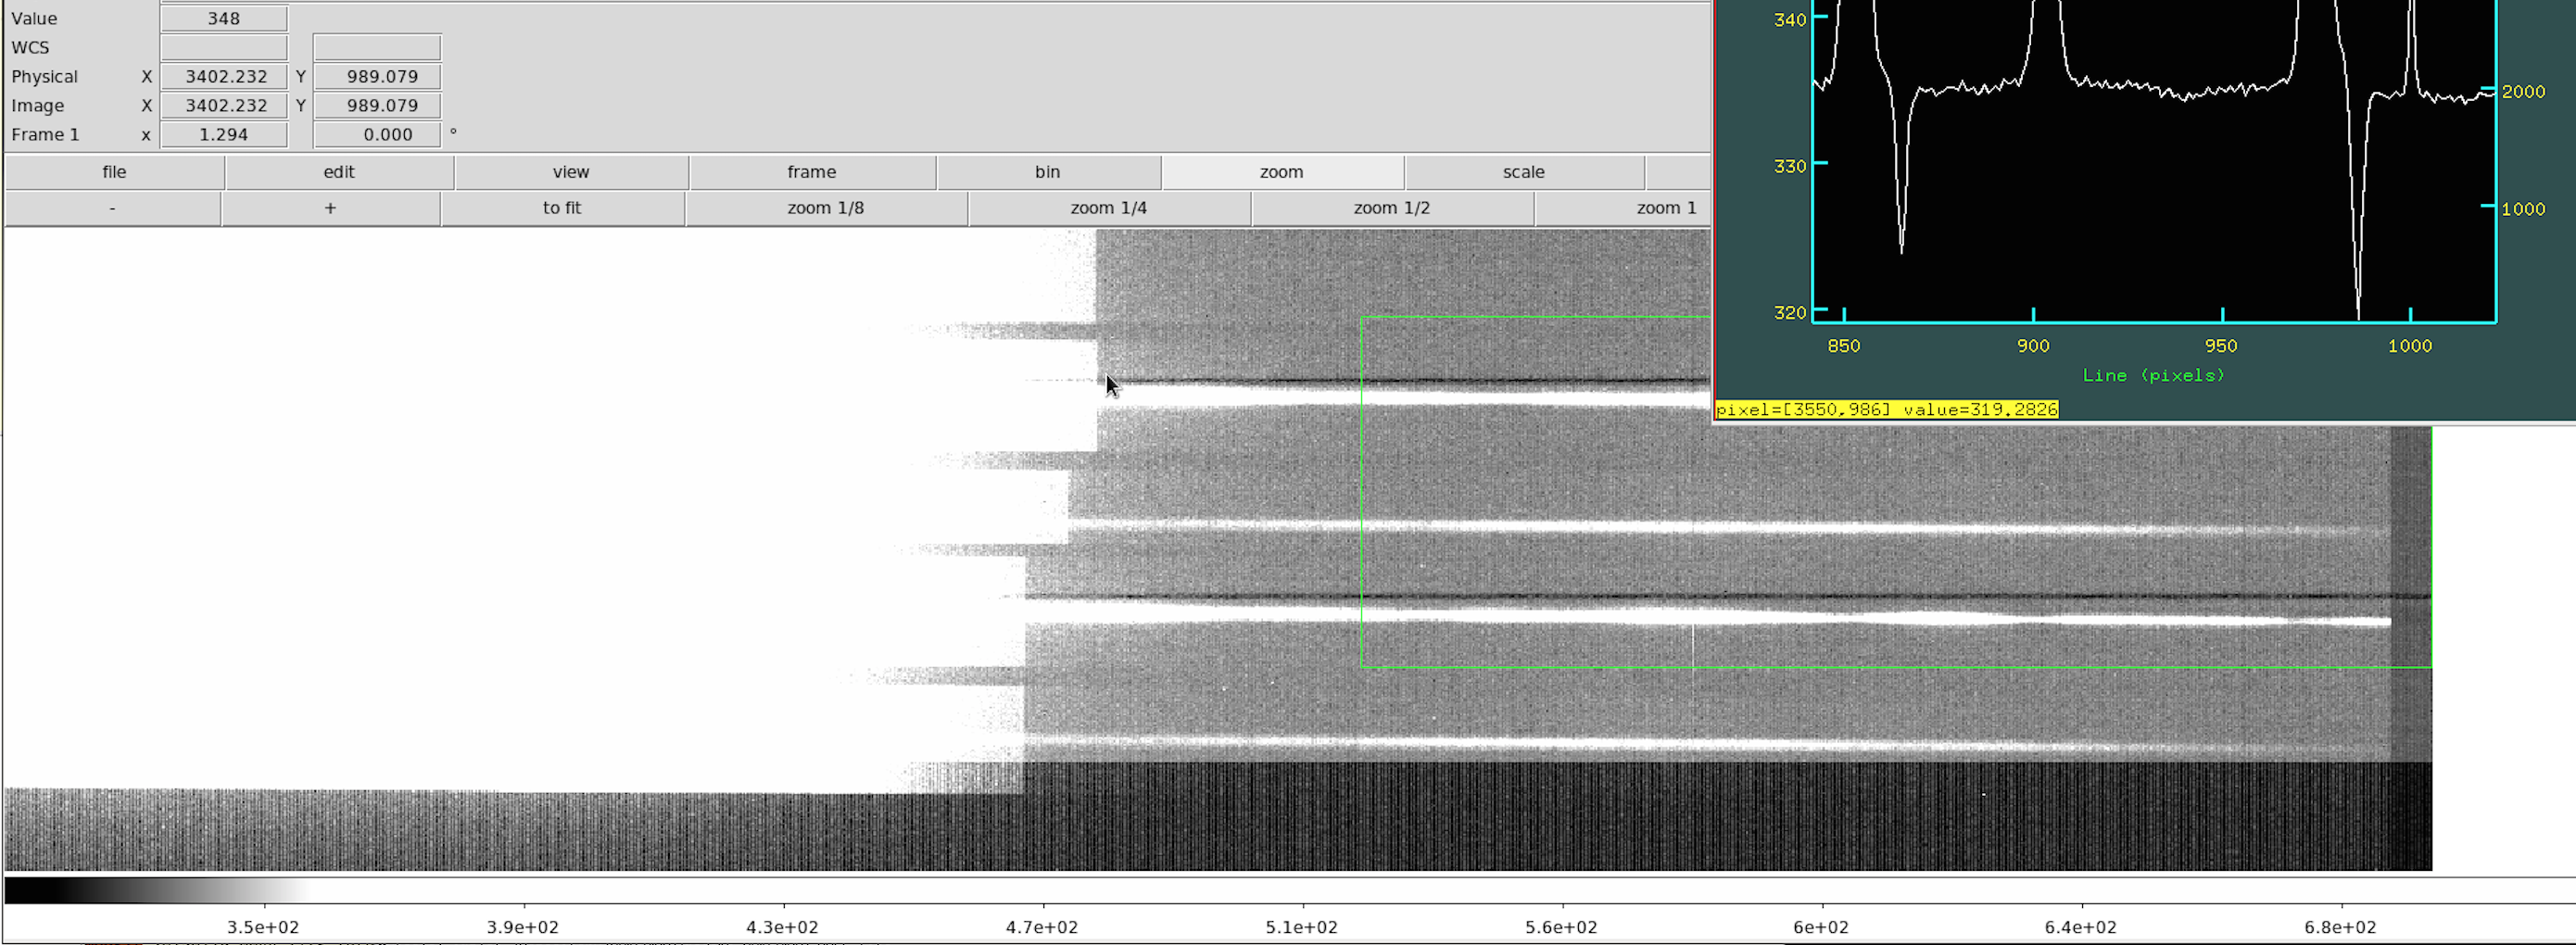


Figure: The dark bands on the 2×2 binned MODS1 Red channel spectra (the top 2 panels: the blue end of the red channel spectrum is at top, and the red end of the red spectrum, in the middle) are binning artifacts. These dark bands are highlighted by the green rectangles and appear as sharp dips around lines ~860 and 990 in the column cuts. They run parallel to the rows, across the entire spectrum and into the prescan regions, even. On 2×2 binned MODS1 Blue channel spectra (bottom), there are similar bands, but in this case they are brighter than the background (to see these, you may need to click on the image to enlarge it).

Central rows noisy (sequencer fault)
Every once in a while, an image appears in which an equal number of rows above and below the central row are noisy, and the noise pattern is symmetric about the central column (see Figure 9.1 below). This is indicative of a sequencer fault.
We have experienced this problem at one time or another on all of the MODS channels. It is typically intermittent, affecting one image but not the subsequent one. Please report images like this. The sequencer board may just need to be reseated, or fibers checked, but unfortunately, it the sequencer may instead need to be replaced. Work is being done towards using a different CCD control architecture, and this would eventually eliminate this problem.

Vertical striping in MODS1B lower right quadrant(Q2)
There is an intermittent issue affecting the lower right quadrant (Q2) of MODS1B, where the counts in even and odd channels differ by hundreds of ADU (>~450 ADU). Because of the readout strategy employed: the detector is read out by four amplifiers, each through two output chains, one for the even and the other for the odd columns, there is normally some vertical striping seen in the raw images, since the bias and gain of the two chains do not match perfectly. However when this issue arises, the striping dominates the raw image. (In pixel and imaging flats where the average count levels are high >15k ADU, however, the effect can go unnoticed in the raw data and appears only in differences or ratios with good images).
This instability is transient and can affect the entire quadrant or only a fraction of rows, as the examples below show.
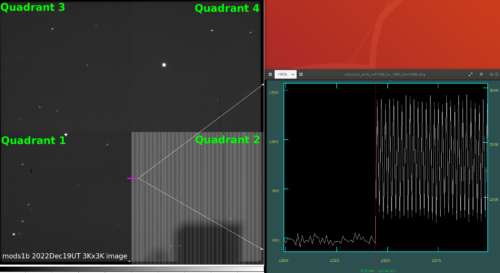

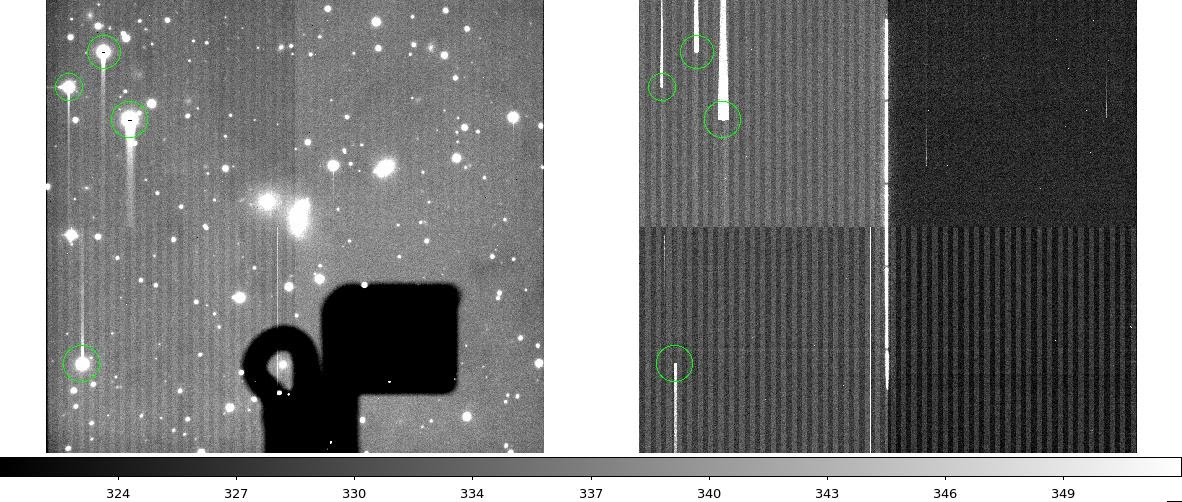
Figure: On the left, a MODS1 Blue 3K x 3K image with the entire quadrant 2 affected. A cut on line 1000 from column 1500 to 1600 (magenta bar in image) illustrates the larger than normal even-odd level difference in quadrant 2. The dark rectangular shadow is of the guide probe. On the right, a raw full frame 8K x 3K MOS spectrum with a fraction of quadrant 2 affected.
This issue first arose in February 2022, but then its frequency tapered off and it was not seen from April through the end of the semester. It came back in mid-October and has been intermittent.
On full frame images where the entire Q2 is affected, the modsBias task within the modsCCDRed package will remove the pattern, as it treats the even and odd columns separately when subtracting the prescan. When only a fraction of rows are affected, however, a more customized approach is needed. When only a portion of the detector is read out (3K x 3K, 1K x 1K images or 4K x 3K prism), there is no prescan region to use to remove the effect.
Intervention poses an unacceptable risk, and so this will remain a feature until the Archon controller upgrade that is planned for the summer of 2025. Please add a note to IT 8654 if the problem is seen.