Spectrophotometric Standards (updated 2024)
MODS Primary Spectrophotometry Standards
Because MODS works from 3200 to >~10000 Angstroms, spectrophotometric standard stars with good fluxes from the UV to the near-IR are needed to adequately calibrate the data. A set of 7 stars form the preferred set of spectrophotometric standards for MODS (the “MODS primary spectrophotometric standards”).
The MODS primary spectrophotometric standards are derived from the HST CALSPEC database and are a combination of well-observed northern hemisphere standards from the list of Oke (1990 AJ, 99, 1621) and the 4 (now just 3) HST white dwarf primary spectrophotometric standards of Bohlin, Colina and Findlay (1995, AJ, 100, 1316), which appear in boldface in Table 1 below.
| Update (Jan 2024): Some changes are being made to the set of MODS Primary Spectrophotometric Standards, primarily to improve the calibration in the blue, where wiggles in the sensitivity function due to the dichroic overlap stellar absorption lines. The changes are indicated in Table 1 below, where the stars that are no longer recommended are in grey font, and the best standards: the HST primary white dwarf calibrators, G191-B2B, GD71 and GD153 are in bold font; remarks are made in the table notes. HZ43 has a nearby M-dwarf which outshines the standard at r_sdss, and care should be taken its acquisition and spectral extraction. The remaining set of 7 stars leaves quite an RA gap and work is being done to fill this in with new white dwarfs from CALSPEC. |
10- and 50-Angstrom Flux Tables
For each primary standard star, flux tables with 10Å bin widths are provided. These tables are in IRAF-style ASCII 3-column format ready to be used with IRAF. Where necessary, HST stellar models or other HST calibration data were used to extend the near-IR wavelength coverage to 10500Å. These tables have the major telluric absorption complexes censored, and the brighter stellar absorption lines have been cut out in most (but not all) tables. They are adequate for grating-mode calibrations, however at the blue end of spectra taken through the dichroic, the resolution may be insufficient to distinguish between the stellar absorption lines and dichroic wiggles.
Tables with 50Å-bin widths are better suited for prism-mode calibrations and these are also provided for most of the stars. The fluxes are based on CALSPEC and the Spec50 flux tables Massey et al (1988, ApJ 328, 315), with extensions to 1 micron from Massey and Gronwall (1990, ApJ 358, 344)
The original, uncensored flux tables are available from the HST CALSPEC database.
Note that the modsIDL Reduction Pipeline uses the full CALSPEC flux tables which are included in the software distribution.
Data on the MODS Primary Spectrophotometric Standards
Useful information on the MODS primary spectrophotometric standards is provided in Table 1 below. The coordinates, proper motions, spectral type and magnitudes are from Simbad. All of these stars are roughly the same color except the redder BD+33°2642, and span about 3 magnitudes in apparent brightness. Their flux tables, at 10 angstrom and, when available also at 50 angstrom, bins are provided in the links and also in this gzipped tar file. The scripts are available on the mountain (obsN) workstations (in /lbt/lbto/mods/modsScripts/modsSpecPhot/) and also can be generated from the MODS OT library.
Table 1: MODS Primary Spectrophotometric Standards
| Star |
RA
(J2000)
|
Dec
(J2000)
|
Sp Type |
m(5556)
(mag)
|
pmRA
(mas/yr)
|
pmDec
(mas/yr)
|
t[Grating]
(sec)
|
t[Prism]
(sec)
|
Downloads |
|---|---|---|---|---|---|---|---|---|---|
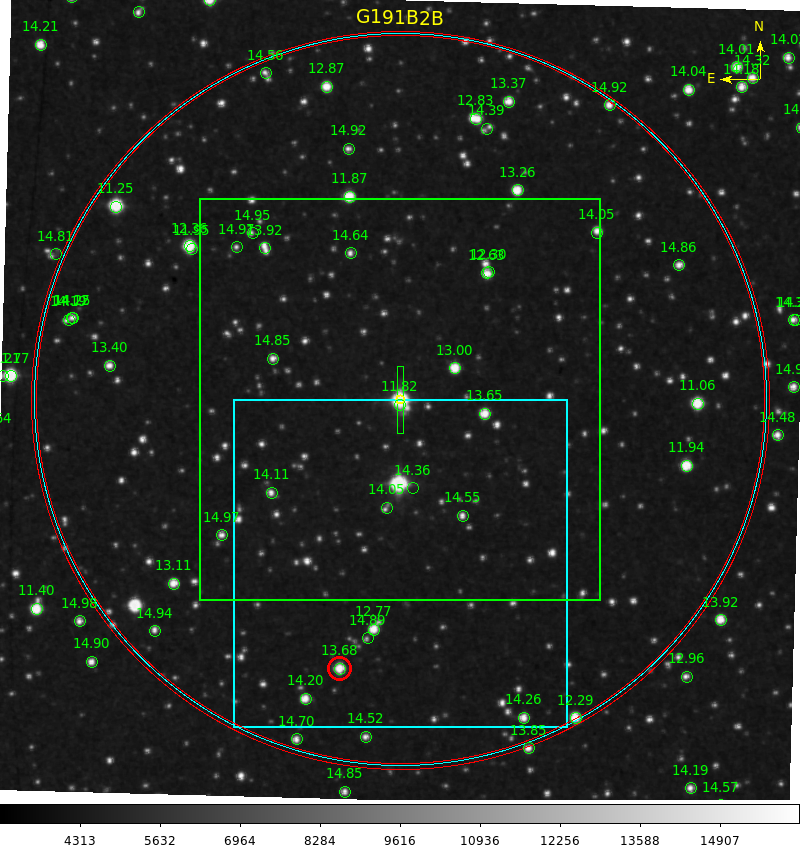
| G191-B2B [1] | 05:05:30.613 | +52:49:51.96 | DA.8 | 11.85 | +7.45 | -89.54 | 90 | 10 | Finder Chart 10Å Flux Table 50Å Flux Table |
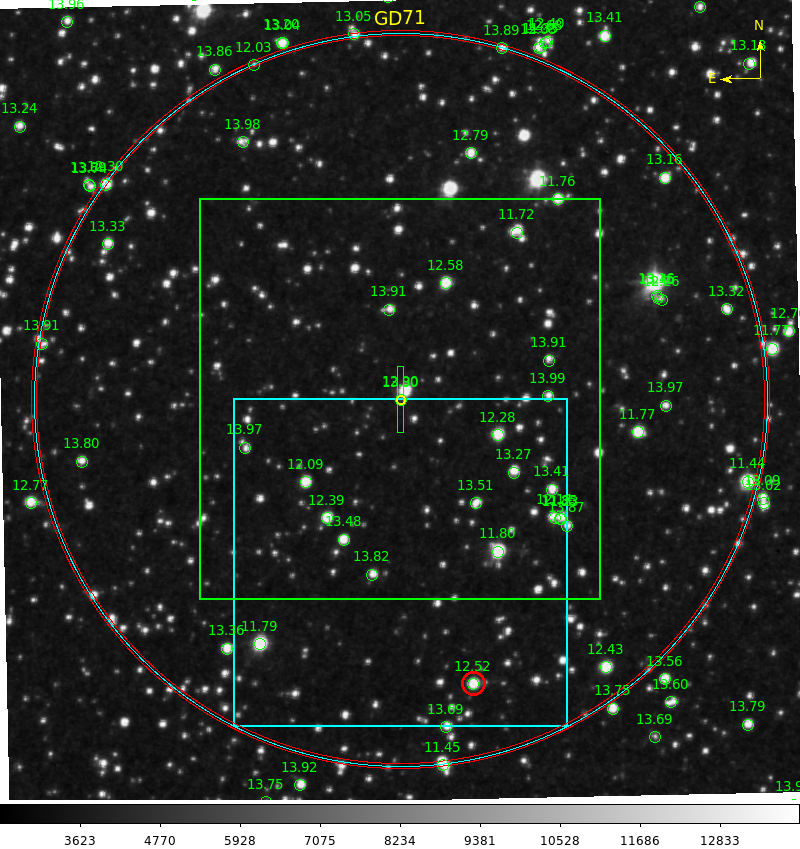
| GD71 [2] | 05:52:27.614 | +15:53:13.75 | DA1.5 | 13.03 | +85 | -174 | 180 | 30 | Finder Chart 10Å Flux Table 50Å Flux Table |
| Feige 34[3] | 10:39:36.740 | +43:06:09.26 | sdO | 11.25 | +14.09 | -25.01 | 120 | 15 | Finder Chart 10Å Flux Table 50Å Flux Table |
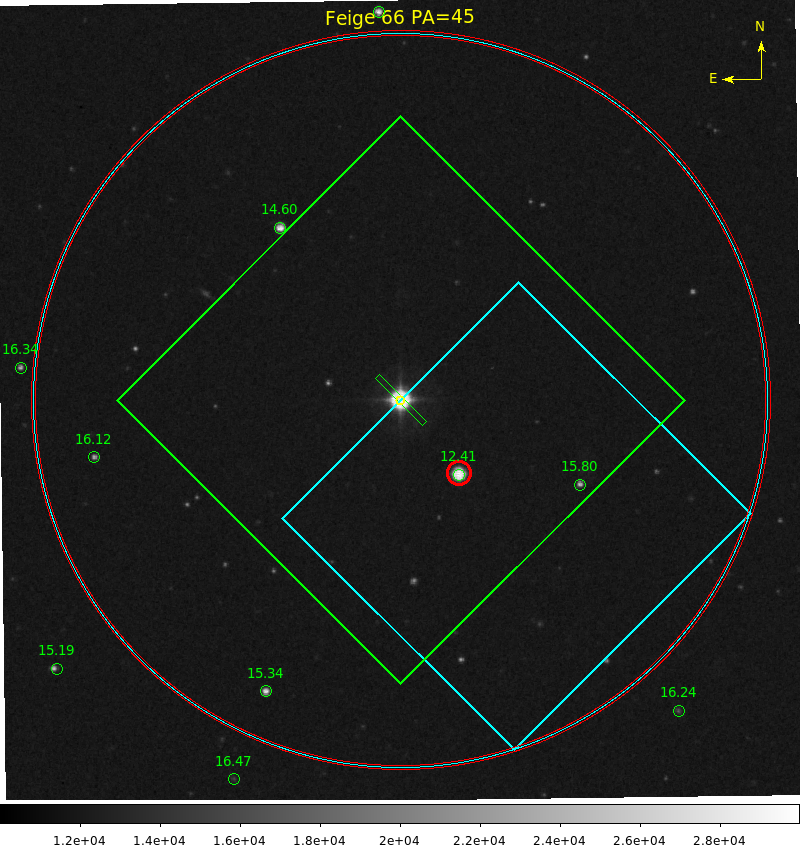
| Feige 66 [4] | 12:37:23.517 | +25:03:59.88 | sdO | 10.54 | +3.01 | -26.05 | 120 | 15 | Finder Chart 10Å Flux Table 50Å Flux Table |
| Feige 67 | 12:41:51.791 | +17:31:19.76 | sdO | 11.89 | -6.15 | -36.27 | 120 | 15 | Finder Chart 10Å Flux Table 50Å Flux Table |
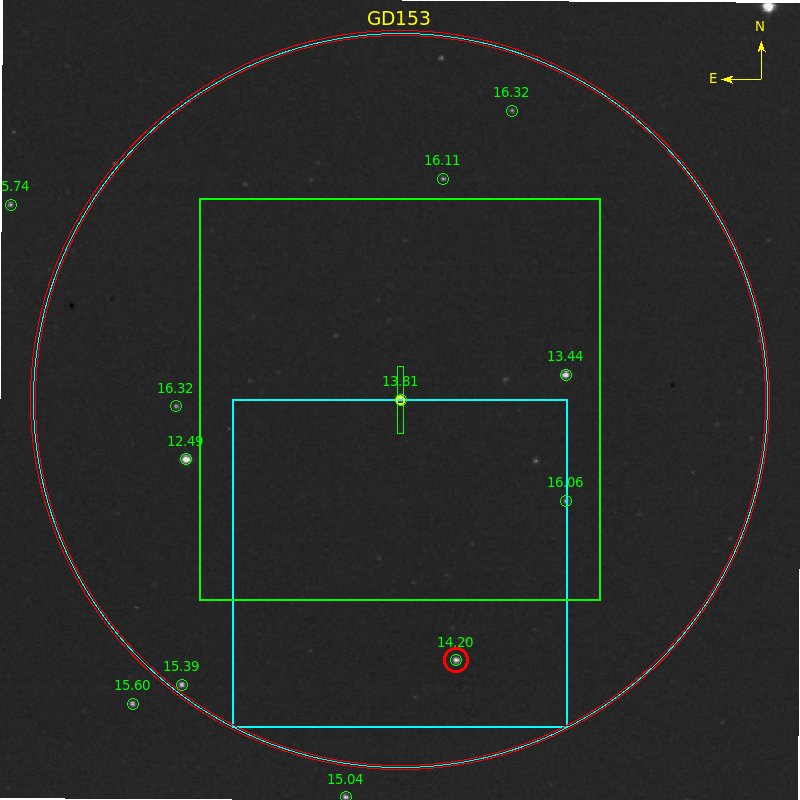
| GD 153 [5] | 12:57:02.337 | +22:01:52:68 | DA1.2 | 13.35 | -46 | -204 | 180 | 30 | Finder Chart 10Å Flux Table |
| Hz 43 [6] | 13:16:21.853 | +29:05:55.38 | DA[1] | 12.91 | -157.96 | -110.23 | 180 | 30 | Finder Chart 10Å Flux Table |
| Hz 44[7] | 13:23:35.258 | +36:07:59.51 | sdB | 11.47 | -61.6 | -3.1 | 120 | 15 | Finder Chart 10Å Flux Table 50Å Flux Table |
| BD+33 2642 | 15:51:59.886 | +32:56:54.33 | B2IV | 10.80 | -13.57 | +0.72 | 120 | 15 | Finder Chart 10Å Flux Table |
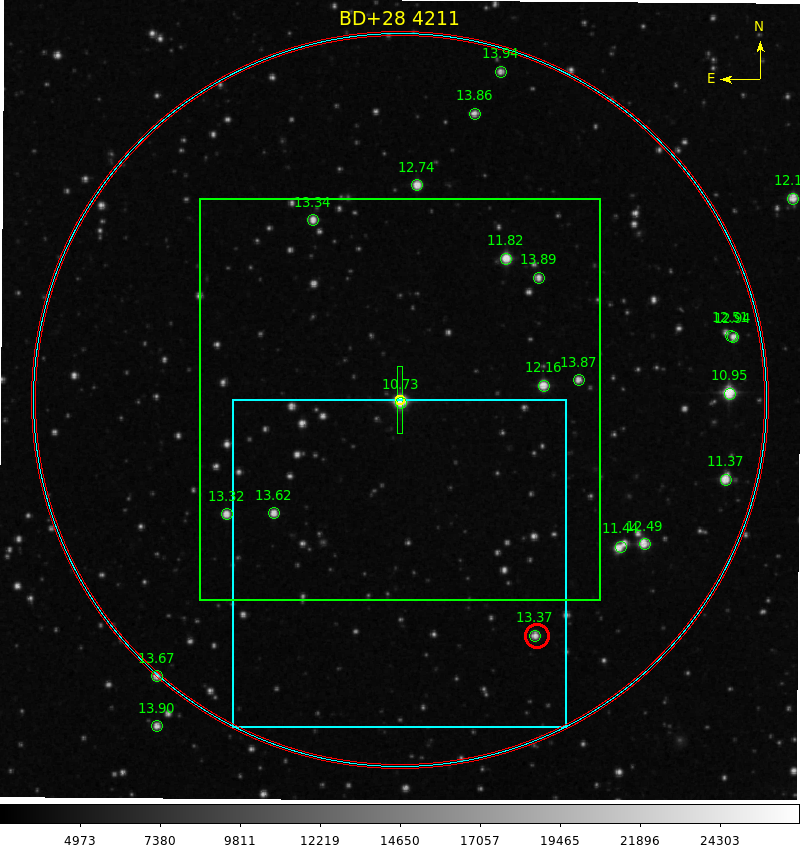
| BD+28 4211 [8] | 21:51:11.021 | +28:51:50.36 | sdOp | 10.56 | -35.55 | -58.74 | 60 | 10 | Finder Chart 10Å Flux Table 50Å Flux Table |
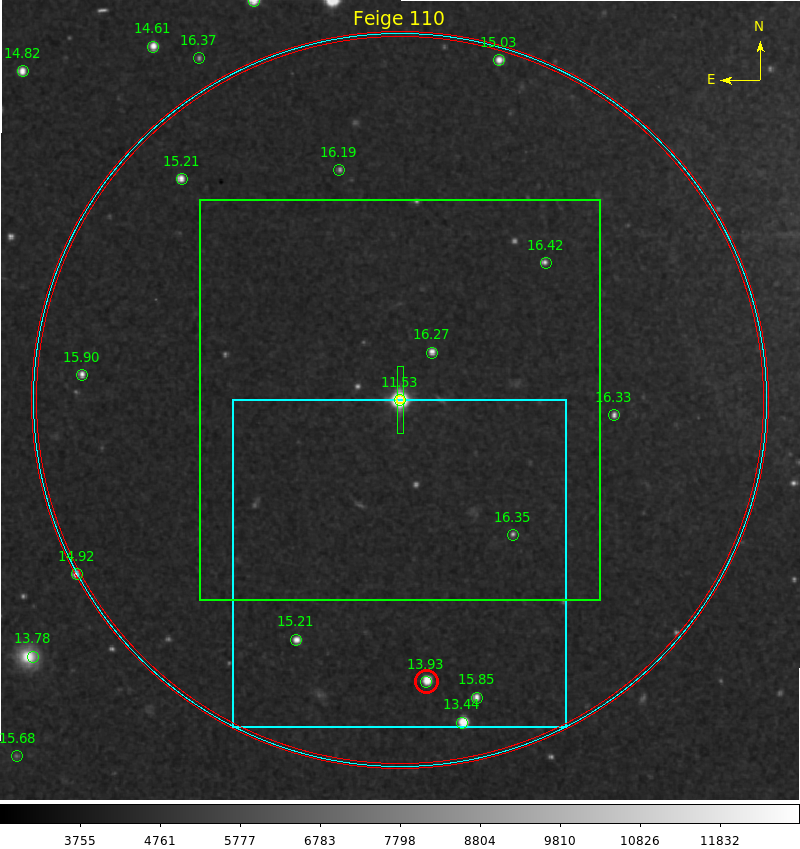
| Feige 110[3] | 23:19:58.398 | -05:09:56.16 | sdO | 11.88 | -10.68 | +0.31 | 90 | 10 | Finder Chart 10Å Flux Table 50Å Flux Table |
[1] – G191-B2B is an HST primary white dwarf star. On the finder chart it is the northernmost of the two bright stars in the field.
[2] – GD71 is an HST primary white dwarf standard stars. The NIR extension is based on HST model spectrum.
[4] – Feige 66 has only relatively low-quality near-IR extension data, and should only be used in the blue or out to about 9200Å.
[5] – GD153 is an HST primary white dwarf star. The NIR extension is based on the HST fluxes shifted by -0.02mag.
[6] – A faint binary M-dwarf companion, Hz43B (V=14.3), is located 3-arcsec away, so this star is not recommended during poor seeing. Hz 43 used to be among the set of HST primary white dwarf stars, but was removed because the M-dwarf was contaminating the STIS data (Bohlin, Gordon & Tremblay 2014, PASP, 126, 711). In MODS red-channel acquisition images, the M-dwarf outshines the standard star. The M-dwarf also appears brighter at the central wavelength of MODS red-channel spectra, so automatic trace-finding algorithms may mistake it for the standard. Like the HST primary WD stars, HZ43’s NIR extension is based on the HST model spectrum.
[8] – BD+28 4211 has a faint red companion 2.8-arcsec away, and is only recommended for use in the blue channel in good seeing.
A model extinction curve for LBT
Table 2: LBT Model Extinction Curve
| λ (Å) | Kλ [mag/airmass] |
| 3200 | 0.866 |
| 3500 | 0.511 |
| 4000 | 0.311 |
| 4500 | 0.207 |
| 5000 | 0.153 |
| 5500 | 0.128 |
| 6000 | 0.113 |
| 6450 | 0.088 |
| 6500 | 0.085 |
| 7000 | 0.063 |
| 7500 | 0.053 |
| 8000 | 0.044 |
| 8210 | 0.043 |
| 8260 | 0.042 |
| 8370 | 0.041 |
| 8708 | 0.026 |
| 10256 | 0.020 |