
Exposure Time Calculator
Overview
To help users plan PEPSI observations, the PEPSI Exposure Time Calculator performs a signal-to-noise ratio (SNR) calculation based on the target parameters (total magnitude and spectral type) for a given telescope/instrument configuration (exposure time, fiber/resolution mode, and cross-disperser) and site condition (seeing and airmass). The output is an estimate for the peak (i.e. in the center of the blaze function) SNR of the specified cross-disperser for an individual spectrum. When using PEPSI in binocular mode, the SNR increases by √2 (assuming both sides have the same throughput). For the polarimeter, the Foster prism splits the light into two and an SNR estimate of the sum of these two spectra is provided.
PEPSI-PFU
The Exposure time calculator (ETC) estimates the flux from the star by using flux templates from Pickles (1998) and from Francis et al. (1991), scaling them using the V-band Vega flux (Bohlin & Gilliland 2004). The flux is then adjusted by using the V-magnitude supplied, and by applying extinction correction using the airmass and the extinction values from the Multi-Object Double Spectrograph (MODS) instrument manual. Depending on the selected instrument setup, the correct entrance aperture for each fibre diameter is used (7.5″, 0.74″, 1.5″, 2.3″ corresponding to the VATT, D100, D200/Polarimeter, and D300 modes respectively) according to Strassmeier et al. (2015), and the losses are calculated for that aperture according to the specified seeing value.
The flux is computed for the size of the central pixel in each Cross Disperser (CD), multiplied for the binning if applicable (the 200µm fiber is 2x binned, the 300µm fiber is 5x binned). The read-noise of the Charge-Coupled Device (CCD) (on average 3.5 for the blue CCD and 4.0 for the red CCD; see PEPSI STA1600 10K science CCD camera implementation details) is added to the photon noise, and the size of each slice (20, 9, 17, 35 for the VATT, D100, D200/Polarimeter, D300 respectively) times the number of slices (respectively 9, 7, 5, or 3) is used to determine the number of pixels (see PEPSI image slicer implementation details). For the overall instrument efficiency values are taken from the PEPSI image slicer implementation details. We determined the peak of the efficiency using the 95% quantile for each CD, fiber and telescope. The average value for both telescopes is used in the ETC (although see details below about DX).
The output is an estimate for the peak (i.e. in the center of the blaze function) signal to noise ratio (SNR) of the specified cross-disperser for an individual spectrum. As of Oct 2023, the SX and DX efficiencies are calculated separately because DX throughput can be up to approximately 30% lower. When using PEPSI in binocular mode, the SNR is the quadrature sum for the two sides, while in monocular mode SX values are used. For the polarimeter, the Foster prism splits the light into two fibers, we give the value of the sum of these two spectra. As there is only one fiber from the Vatican Advanced Technology Telescope (VATT), the monocular mode is always used in that setting.
PEPSI-POL
Determining exposure times for PEPSI-POL is a little more involved than simply computing the SNR as in ordinary spectra. Instead, we are more interested in detecting a particular fractional polarization as a function of wavelength. Since the normalized Stokes parameter (e.g. q = Q/I) can be calculated from the ratio of ratios of the flux from each ordinary and extraordinary beams across both exposures (PEPSI-POL observations use only two retarder/Foster prism positions per Stokes parameter), the error propagation can be thought of in terms of the sum of inverse variances after taking the natural logarithm.
Using Stokes Q as an example, if σq is the standard deviation in the fractional polarization uncertainty, and sbeam is the SNR for each fiber (four total) on one image, then it can be calculated by:
σq = 1/(2sbeam)
If Simage is the total SNR (e.g. from the ETC or as measured on one image), then:
sbeam = Simage/2
Both of these equations assume all 4 fibers have identical SNRs. However real world effects mean not every fiber will have the exact same SNR, along with other second order effects (see Ilyin et al. 2012). To account for this we use the total SNR of the image which combines the SNR from all four fibers. In the ideal case under the best achievable photon-noise precision, the fractional polarization uncertainty σq is expressed below where Npair is the number of image pairs (per Stokes parameter), and Simage is either the SNR measured on one image (not pair) or the output from the ETC:
σq = 1/[Simage√(2Npair)]
An SX/DX throughput difference does not by itself change this relation since it is already reflected in Simage and the ETC, however an imbalance in the throughput of the ordinary and extraordinary beams or other systematics will turn it into an inequality (>). Finally we can show in terms of the desired polarization magnitude expressed as a fraction p, to be detected at a threshold of nσq, the required SNR per image Simage is:
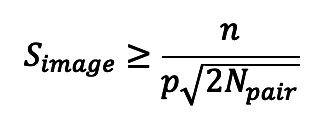
The inequality here represents real-world effects such as unequal beam throughputs and other systematics. However if Simage is taken from the ETC rather than measured directly, variations in seeing, transparency, guiding errors, and other realities of observing can further reduce the delivered SNR. It is also important to note that these results assume first-order error propagation in which non-Gaussian effects are negligible. In other words the individual extracted beam fluxes should have sufficiently high SNR that their uncertainties are approximately Gaussian and not dominated by background subtraction or other low-count effects. For further reading see Patat & Romaniello (2006) and Bagnulo et al. (2009).
For example to detect a fractional Stokes V polarization of 0.1% at a 3σ detection threshold, one would need SNR=750 per image for eight pairs using the above equation. If the target is a V=8 mag F0V star, an exposure time of 800 sec. would yield an SNR=750 for CD5, therefore the total time would be 12,800 sec. or about 3h 33m (before adding on readout and other observing-related overheads).
Although this may seem like an expensive observation, it is possible to increase the SNR by binning the polarization spectrum (which has a native resolution of R=130k). Another method is to use Least-Squares Deconvolution which can substantially improve the effective polarization sensitivity by combining information from many spectral lines at once. This is a technique similar to cross-correlation if one isn’t necessarily interested in measuring the Stokes parameter at every spectral element (see Donati et al. 1997). This reduces the required SNR per image into something more manageable for high-precision spectropolarimetry, although the gain depends on the number, strengths, and weights of the usable spectral lines.