Software
Contents:
Login
- Use your favorite vncviewer to connect to alpha.pepsi.lbto.org:1
- display :1 contains the User Interface
- display :2 contains the PEPSI instrument telemetry
- Note: you must be on the lbto network to access the Pepsi vncviewer
Startup Instrument Interface
The User Interface desktop is typically populated with all GUI’s needed to run the instrument. If there is an issue or if the GUI’s are closed for any reason they can be brought up by:
- Preferred: From a terminal on pepsi@alpha.pepsi.lbto.org vnc session session type
pepsi
- Another option: Open by clicking Activities in the upper right corner. There is a menu with the PEPSI logo. Select that logo to open the program
Pepsi User Interface Desktop 1:

The user interface will look slightly different for PFU (as shown above) and polarimetry observations.
Pepsi Telemetry on Desktop 2:

Observing Interfaces
Desktop 1 contains the PEPSI User Interface. This has all GUI’s necessary for operating PEPSI at night. Many of these interfaces are also used in the OB generation.
PEPSI Spectrograph Control Interface
This GUI is used to select the telescope (in our case LBT), and execute exposures. From this interface, exposure times can be adjusted in real-time.
This GUI is the base GUI from which many other interfaces are opened. The mode of operation is selected from this interface to bring up the relevant telescope interface.
To observe with the LBT PEPSI PFU, check the LBT radio button. This will open the PEPSI LBT GUI. Also check that the PFU button is selected.

If observing with the Polarimeters, Select the LBT and the POL radio buttons on the left of the spectrograph GUI. This will bring up the PEPSI LBT GUI. Select the POL spectrograph configuration.

From this interface, exposure sequences are started, stopped (stop and read out), or aborted (stop and discard exposure). Note if an exposure is “stopped” the next exposure will start (if there is one). The top part of this interface shows the exposures that will be taken — these are denoted by check marks next to the line that indicates the exposure time for an individual frame and can be edited in realtime. However presetting from an OB (see below) will automatically populate the fields, and this normally doesn’t need to be edited.

PEPSI LBT GUI
This interface is used to open the engage operations (opening the hatches), starting guiders, and sending Telescope Presets.

Guiding is shown on the top left of the GUI, with N and E orientation indicators for the direct-reflected PFU guider image to facilitate navigation in crowded field. “Engage” will open the hatches and enable the ADCs in preparation for nightly operations. A User can select one or both SX and DX telescopes. The telescope preset is populated from information sent from the Observing Programmes GUI (see below) and sent through this interface. The lower left contains a quick-look plot that the users can select depending on the preference: seeing, guide star flux, humidity, and wind speed. Note that the guide star flux is now in magnitudes V=22.5-log10(flux*2.4) with flux from guider image FITS header and 2.4 e/ADU is the gain factor (ignoring beam splitter attenuation). The guiding is activated and plots are provided by selecting the “Guider” check box at the bottom. Guiding and collimation status is also provided in the lower right quadrant. From here the user can adjust the binning or filter. Note that by adjusting the filter for one telescope, the parameters are automatically adjusted for both.
Guiders
This is opened when the Guider radio buttons at the base of the PEPSI LBT GUI are selected. This is typically started once the slew is initiated to the first target of the night.

If the target is too faint (poor seeing, clouds, etc) to converge, the observer can adjust the guider’s ND filter on the fly (second to bottom row on the PEPSI LBT GUI) or increase the guider binning. Changing binning on one side will automatically update the other side. More details on PFU guiding can be found here.
Observing Programmes
This GUI is brought up from the “Program” button in the lower right of the PEPSI Spectrograph Control Interface GUI. The target OB is selected from this interface. This GUI summarizes the date, targets, basic configuration information, start and finish time for each target, and the PropID. Press F2 to sort blocks in RA, and Ctrl-F2 to sort in PID and RA. There is also a priority column added to the catalog of objects, which will be shown in OB. By changing it to e.g. zero in the catalog and “reload object records” in OB will indicate that it has been observed. To preset an observing program, select the program in the Observing Programmes GUI, click the blue right arrow button in the top row of buttons, then click Preset in the PEPSI LBT GUI window.

Edit Observing Block
This GUI is used to Edit the Instrument Configuration. Opened from the “Edit Observing Blocks” button on the Observing Programs GUI (the left-most Icon at the top). The user can use this to set the Exposure Time, Cross Disperser, Number of Exposures, Fiber, Beam Splitter, Mirror, Guider Filter, FPE, Instrument (PFU, POL, etc), Number of Cycles, and Overhead Time (the planning nominally assumes 2 minutes of overhead per target for preset).
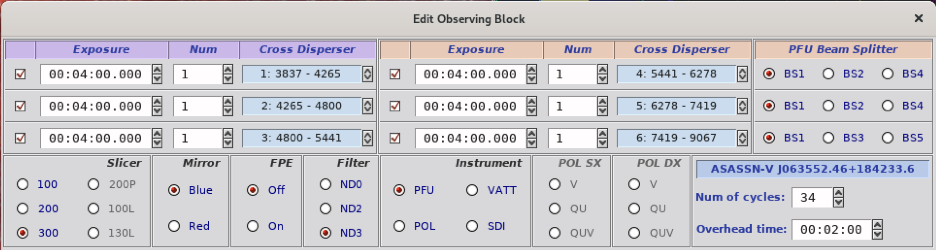
The checked items in the table are executed row by row. If the blue configuration is checked in one row and the red in a different row, the blue and red exposures will be executed serially. So in the above example, the instrument will be configured with the 300 image slicer, PFU, and ND3 for the guider (a bright source). The first exposure will be 4min with CD I and CDIV simultaneously, the second will be 4 min CD II & CD V, and the third will be 4min with CD III and CD VI. The cycle of 3 will be repeated 34 times.
Target Visibility
Allows the users to visible see the target airmass for the observing window. Target selected will be highlighted.

Photon Counter
The photon counter can be used to adjust the exposure time given a particular photon threshold. Once a photon threshold is achieved the readout will be triggered. This allows for consistent SNR in varying conditions.
Fits Image Browser GUI and Viewing Data
As images are read out they are listed in the FITS Image Browser. The latest PEPSI RED and BLUE images are automatically displayed in the viewer. This viewer contains a number of tools for basic data quality assessment. Images can be added and analyzed from the “FITS Images Browser”.
Select the spectrum (highlighted with teal colour) you want to look at from ‘FITS Image Browser‘ with Enter or click the arrow icon to send it to “Spectrum viewer.” One can also look at multiple spectra by selecting them and clicking the double arrow icon.

Note that when adding images, they will appear in the active window in the Spectrum Viewer (not necessarily in the red and blue orientation. The active window in ‘Spectrum Viewer ‘ has a cyan frame. Select the area you want to look at closer by drawing a red box with, for example, a mouse. To see a summed spectrum from a selected area Press ‘Enter‘, or Click the normal ‘Sigma‘ icon (one-dimensional cross-cut in the horizontal direction, i.e. collapse and sum up each column) on top of the viewer (the other sigma computes the cross-cut in the vertical direction).
To Check SNR:
- click on box – press ‘Alt’ + ‘c’ or draw with a mouse (with Macs use ‘Cmd’ in place of ‘alt’).
- Draw box across a single order to estimate S/N
- Select the Σ button to extract a horizontal spectrum plot.
- In the extracted spectra, draw a box from the highest continuum value to the lowest

- In the case of FPE, be careful to not be distracted by the FPE peaks.

- In the case of FPE, be careful to not be distracted by the FPE peaks.
- Hit the ‘Sun’ Icon. This will bring up a Signal/Noise pop-up containing the S/N estimate.

- The results can be saved to the header and will be displayed in the Fits Image Browser GUI table by selecting ‘Save’ in this popup.


To check for Saturation:
- click on box – press ‘Alt’ + ‘c’ 3 times (with Macs use ‘Cmd’ in place of ‘alt’). The first time centers a box on the full frame, the second brings up a horizontal line cut, and the third will bring up a vertical line cut
- Select the sideways sigma – extract a one-dimensional cross cut in a vertical direction – to plot the counts in the cross-cut.
- Counts should ideally be below 20K .
- Check images for saturation:

Calibration Sequencer
The CALIB button in PEPSI Spectrograph Control Interface will launch the calibration sequencer. This window can also be accessed by pressing F9 on the Observing programmes window, or on the top menu Table –> Prepare calibrations. When doing calibrations, the Calibration sequencer must remain open.
Launching the Calibration Sequencer:

PEPSI Calibration Sequencer:

To use the calibration sequencer the check boxes for the relevant fibers corresponding to the desired calibrations are selected. Typically ThAr and Traces are executed daily. The calibration sequencer works in concert with the Spectrograph Control Interface. The corresponding desired cross dispersers (for the requested fiber) with predetermined times are selected in the PEPSI Spectrograph Control interface. When ready click START, this will automatically close the hatch (i.e., dis-“engage”) and configure the instrument before taking exposures. Cals aren’t impacted by dome lights or telescope motion, etc.
NOTE: That the calibration sequencer will by default only execute observations for the current table of observations (the Observing programmes window). Additional calibrations can be taken by selecting different combinations of fiber and/or ThAr and Traces, and selecting the desired CDs.