Finding Charts
Finder Chart Requirements
A Finder Chart should have the following:
- The science target should be clearly indicated. If the science target is not visible (too faint or a diffuse object), the reference source and offsets to the science target should be clearly marked.
- The target name or script name should be clearly indicated on the finder chart.
- North and East should be clearly indicated
- The scale needs to be indicated by drawing a bar and writing the bar length in arcseconds or arcminutes.
- The observed band or filter of the image should be indicated and should match that of the acquisition image taken at the LBT
- The image should reach about the same depth as expected in an acquisition image at the LBT
Generating Finding Charts
The most convenient way to produce finding charts for LUCI is to use the OT. Once you have created an Observation with target coordinates, click on the “image” button to open the Position Editor.
Different catalogs can be accessed to display images to match as closely as possible the science observation filters. 2MASS makes a decent background image for LUCI acquisitions. They are available in the JHK bands, and anything you can see on a 2MASS image you can centroid on in a 60s (NDITxDIT) sky-subtracted exposure with LUCI. Finding charts based on SDSS or DSS images can also work well, but keep in mind that sources can look very different when comparing images taken in the optical and near-IR bands.
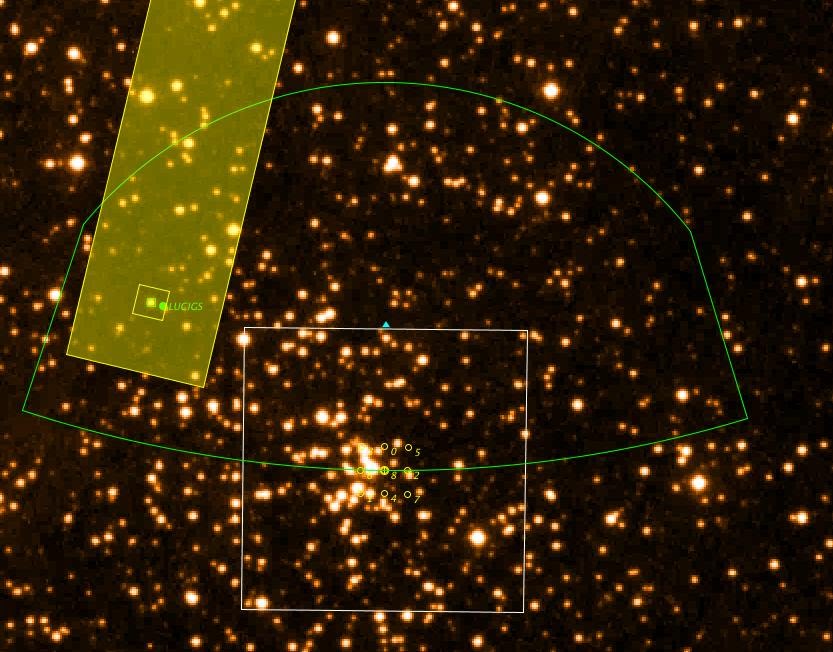
Details about using the Position Editor can be found here. Then click File -> Save As and check “Save Current View” to save the image as a JPG. If you have a higher quality FITS image of your target (with accurate WCS) that you would prefer to use, then you can also open this in the OT. Below is an example of jpg output, showing the LUCI FOV, Guide Patrol Field, and Guider.